Decoding Smallcase Returns
There is no doubt that smallcase has revolutionized investing for retail investors using model portfolios. While there are multiple types of smallcase portfolios, it becomes a daunting task to analyze returns and choose a portfolio. Your returns are impacted not only by the performance of your portfolio but also fees you are paying, turnover and broker you are using.
Let’s look in detail at each of these.
Fees
Fees is probably the most important factor for your smallcase returns. Broadly there are two kind of fee structure available. Fixed feed and AUM based fees.
Under fixed fee structure one pays a fixed fees irrespective of the amount one invests. This is good for those who are investing larger amounts and hurts someone who is investing smaller amounts. On the contrary, AUM based fee structure is good for small amounts, but your fee keeps scaling as your fund size does.
There is no one better structure but one must determine how much they are paying as a percentage of funds invested. It should be around 2-3% of the overall funds invested.
For example, if one is paying Rs 3000 in annual costs, in that case he should invest at least Rs 1 lac for fees to be below 3%. If in case the investment size is Rs 50000, then this fee will amount to 6% of the funds. Investors can start with higher fee structure but should quickly scaleup their investment amount via SIP.
Slippage costs
Last few months, smallcase has made tremendous progress on the transparency on their platform. Now one can see the impact of rebalancing, brokerage and other costs on their portfolio.
There is a link below the performance chart of the portfolios which tells us about the cost-adjusted performance of the portfolio. One needs to login via his broker so that smallcase uses the brokerage of your particular broker in the cost calculations.
For example Gulaq Gear-6 cost adjusted performance can be seen using this link – https://www.smallcase.com/smallcase/estee-long-alpha-lite-(gear-4)-ESTMO_0001/cost-adjusted-returns
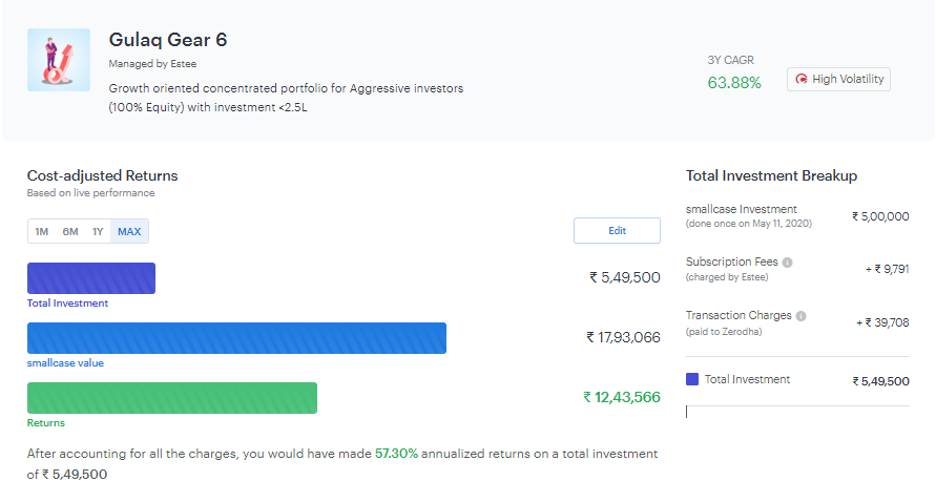
In case of a discount broker like Zerodha and investment amount 500,000, which one can edit, we can see that since the launch the investor would have paid total subscription fees of Rs 9791 across the three years and with charges would have made a profit of 12,43,566.
The total returns shown in that chart are 260% of initial investment amount and the realized profits are 248%. The net impact of costs is just about 12%.
Now let’s look at another portfolio of some other manager.
This portfolio has given about 220% since its launch in 2019.
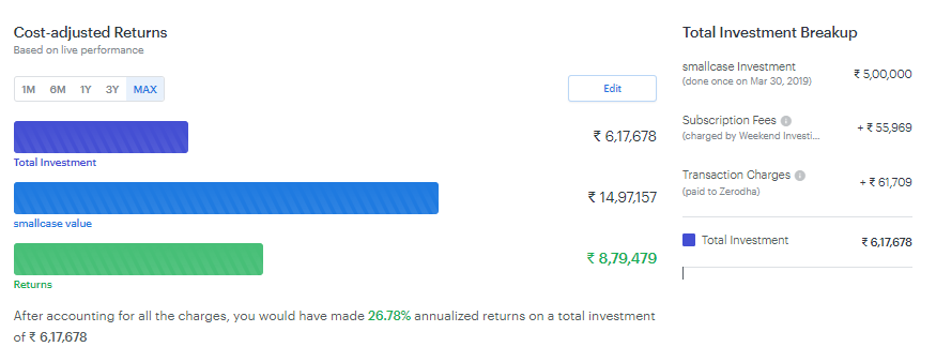
As you can see this portfolio has given 8.79 lacs of profit which is about 176%. So, there is an impact (or leakage) of 44% (220 – 176), as compared to Gulaq impact of about 12%.
Impact of brokerage
Now let’s see the impact of investing via a discount broker and a full-service broker.
We saw earlier that investment of 5 lac would have resulted in total transaction charges of 39708.
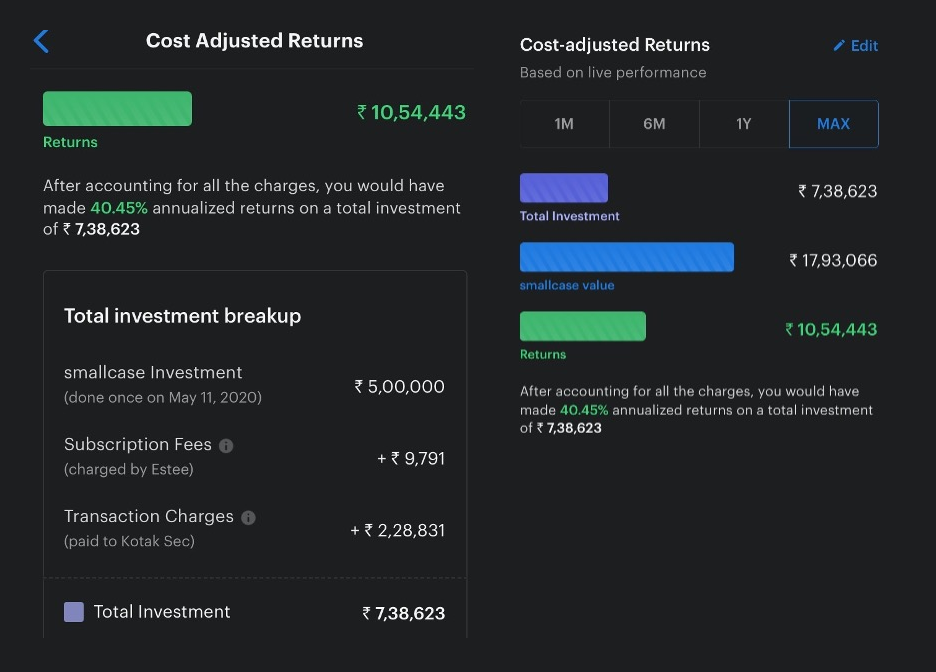
Same investment done via a full-service broker would have resulted in transaction charges of 228831 and profit of 10.54 lacs.
You are paying almost Rs 2 lac more in case of a full-service broker.
Impact of using next day close prices
One can also use “Next day Market Close” price in the options to see how one day delay in rebalancing would change the profits.
In case of Gulaq Gear-6 if we use the “Next day Market Close” the profits increase to 12.70 lacs from 12.43 lacs. This is not to suggest that an investor should rebalance with a one-day delay, rather we are making a point that one day delay in case of Gulaq portfolio is not impacting the profits a lot.
Subscribe to our Newsletter
Related Posts
Tax Harvesting: How to Reduce Your Tax Burden?
FY 23-24 has been great for Gulaq. We were able to generate phenomenal returns for…
Don’t Miss the Forest for The Trees: Why Maxing Out the Rs. 1.5 Lakh Limit on Your PPF Before 5th of April Is Not Worth the Hype
As the financial year has ended, the buzz around investing the entire Rs. 1.5 lakh…
Why Active Fund Investing is so hard?
Would you consider investing in a fund that has significantly trailed its benchmark over the…
Halo Effect can be Dangerous to your Portfolio!
Charlie Munger once famously said, “It is remarkable how much long-term advantage people like us…


