
Related Posts

September 11, 2025
Smart Beta Strategies: What Investors Should Know Before Investing
Smart Beta Strategies: What Investors Should Know Before Investing As of August 2025, Indian mutual…

May 7, 2025
Process Matters More Than Outcome
I have spent nearly a decade of my life trading energy derivatives, and today I…

April 30, 2025
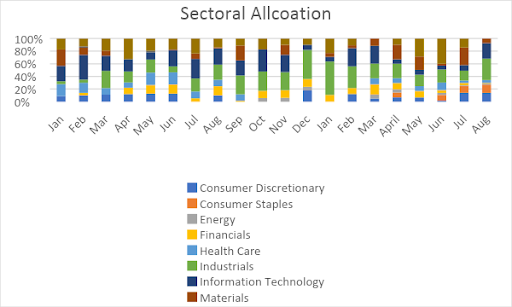
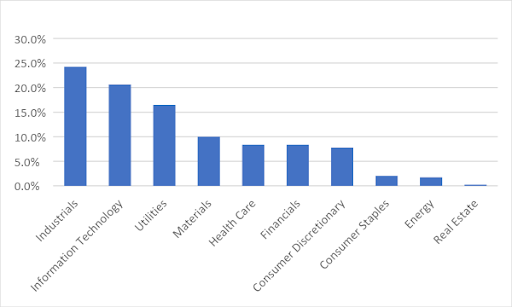
Is Market Cap the Best Way to Build an Index?
Nifty 50 is a free-float weighted index – a slight variation of market cap weighted…
April 23, 2025
3 Books That Changed How I Think About Risk and Markets
Over the past two decades, I’ve built a quiet but consistent habit — reading. Not…