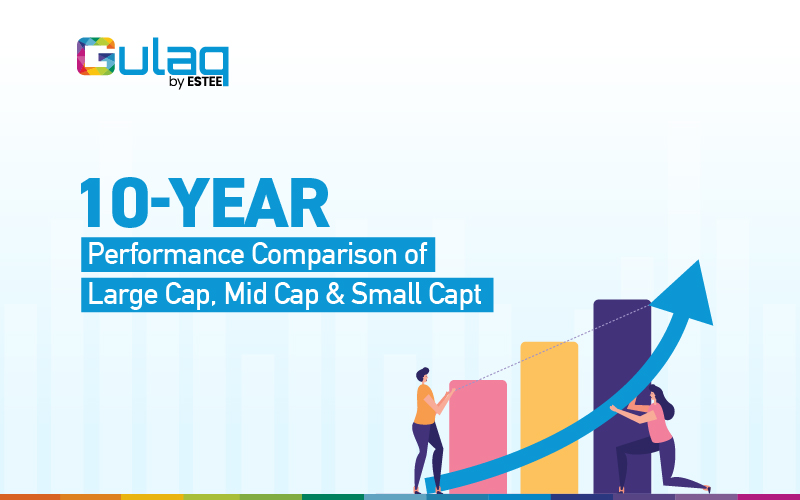
10-Year Performance Comparison of Large Cap, Mid Cap, & Small Cap
If you had invested Rs.100 each in Large-Cap, Mid-Cap, & Small-Cap, what would your investment be worth today?
In this blog post, we are going to take a deep dive into the last 10-year performance of each category and compare how they stack up against each other. Let’s get started!
What are Large-Cap, Mid-Cap, and Small-Cap Funds? SEBI categorizes each listed company in India based on their market capitalization.
- Large Cap
The top 100 companies are categorized as large-cap. They generally have a market cap of over Rs.20,000 crores.
For our analysis, we are going to take Nifty 50 data as a representative of large-cap performance. - Mid Cap
Companies that rank between 101 and 250 in terms of market value are classified as mid-cap. These companies have a market cap somewhere between Rs.5,000 to Rs.20,000 crores.
For our analysis, we are going to take Nifty mid-cap 100 data as a representative of mid-cap performance over the decade. - Small Cap
Companies ranked 251st and onward are classified as small-cap. These companies have a market cap of less than Rs.5,000. For our analysis, we are going to take Nifty small-cap 100 data as a representative of small-cap performance over the decade.
Now let's jump to the fun part!
How much would your Rs.100 be worth today under each category?
| Large Cap | Mid Cap | Small Cap | |
|---|---|---|---|
| Value of Rs.100 invested 10 Years ago | 346 | 562 | 430 |
| 10 Yr CAGR | 13.2% | 18.8% | 15.7% |
| No. of Years with Negative Returns | 1 | 2 | 3 |
| No. of Years with Positive Returns | 9 | 8 | 7 |
As you can see, your Rs.100 would be worth about Rs.346 today if you invested in large-cap, about Rs.562 if invested in mid-cap, and about Rs.430 if invested in small-cap.
In terms of absolute returns, mid-cap emerges as the clear winner, followed by small-cap and large-cap. However, merely looking at the returns without factoring in the risk would be an unfair comparison since risk and return are more often than not positively correlated, meaning, a higher return comes with a higher risk.
Investors generally perceive large-cap as less risky compared to mid-cap and small-cap. The frequency of negative returns aligns with this perception, as large-cap experienced negative returns only once, followed by mid-cap with two instances, and small-cap with three.
But let's take a deeper look into the risk.
Risk & Return
We are going to use 3 measures to analyse risk and return - Standard Deviation, Max Drawdown, and Sharpe Ratio.
Standard deviation is a risk measure that captures the amount of variability in returns. For example, a stock with an average return of 8% and a standard deviation of 10% would, on average, deliver returns ranging from -2% to 18% (8% +/- 10%). A higher standard deviation would increase this range and thus more significant fluctuations, reflecting greater potential investment risk.
Max drawdown is the largest percentage decline in the value of an investment from its peak to its lowest point. For example, if your investment peaks at Rs.1 lakh and then drops to Rs.80k at its lowest, the max drawdown would be 20%.
Lastly, the Sharpe ratio is a measure of risk-adjusted return – return earned per unit of risk. It's calculated by dividing the investment's excess return (return above a risk-free rate) by its standard deviation. A higher Sharpe ratio indicates better risk-adjusted returns.
Here is what the numbers look like:
| Large Cap | Mid Cap | Small Cap | |
|---|---|---|---|
| Annual Standard Deviation | 12% | 25% | 33% |
| Max Drawdown | -38% | -49% | -65% |
| Sharpe Ratio | 0.75 | 0.65 | 0.46 |
The riskiness of each category followed the expected order, with large-cap being the least risky, followed by mid-cap and small-cap.
The Sharpe ratio, a metric that gauges returns earned per unit of risk, offers a more insightful perspective.
Large Cap has a Sharpe ratio of 0.75, indicating that the large-cap index earned a 0.75% return for taking a 1% risk. In contrast, mid-cap has a Sharpe ratio of 0.65, meaning it only earned 0.65% return for 1% risk. small-cap performed even worse, earning just 0.46% return for 1% of risk.
Large Cap, which looked the worst when compared using the absolute return, now looks the best when compared using a risk-adjusted return measure. This is why you should never compare the absolute returns of two distinct portfolios and always look at return in conjunction with risk.
But what if I tell you that there is a secret by which you can reduce the risk without necessarily having to compromise on the return?
And that secret is – "patience".
Yes, you heard me right. You can significantly reduce the risk of your portfolio without compromising on return by merely increasing your investment horizon.
I took the past 10 Years of Nifty 50 data and calculated the 1-year, 3-year, and 5-year rolling returns:
| 1 Yr Rolling Returnsn | 3 Yr Rolling Returns | 5 Yr Rolling Returns/th> | |
|---|---|---|---|
| Average Return | 12% | 12% | 11% |
| Min Return | -34% | -6% | -2% |
| SMax Return | 96% | -31% | 18% |
| Probablity of Negative Returns | 19% | 2% | 1% |
Here are some interesting observations: -
- The average return remains consistent and hovers in the range of 11-12% as we increase the investment horizon from 1 year to 5 years.
- The risk, however, reduces drastically as we increase the investment horizon.
- If your investment horizon is just 1 year, your returns could have ranged anywhere from -34% to +96% with a 19% probability of making a loss.
- Increase that investment horizon to 3 years, and now you'll have a much narrower range of -6% to 31% with only a 2% probability of making a loss.
- Increase it to 5 years, and now you are almost guaranteed to make a profit with only 1% empirical probability of making a loss.
The market rewards long-term investors, and the sooner you realize it, the more likely you are to build wealth without having to get lucky.
Bottom Line
In this blog post, we looked at the last 10-year performance of large-cap, mid-cap, and small-cap. Where mid-cap performance seemed the best in terms of absolute returns, large-cap seemed more attractive when compared using a risk-adjusted return measure.
This does not mean that I am advocating to put all your money in mid-cap or even in large-cap. In fact, we at Gulaq give utmost importance to not only diversify across sectors but also across market caps to deliver consistent performance. Check out our flagship Gulaq Gear 6 Portfolio to know more about our investment strategy
The key is to success in the market is to aim for the long. Short-term can be highly volatile but as you increase your investment horizon, the risk gradually diminishes and you are more likely to make a healthy return without having to get lucky.
Happy investing and thank you for reading!
Related Posts
Tax Harvesting: How to Reduce Your Tax Burden?
FY 23-24 has been great for Gulaq. We were able to generate phenomenal returns for…
Don’t Miss the Forest for The Trees: Why Maxing Out the Rs. 1.5 Lakh Limit on Your PPF Before 5th of April Is Not Worth the Hype
As the financial year has ended, the buzz around investing the entire Rs. 1.5 lakh…
Why Active Fund Investing is so hard?
Would you consider investing in a fund that has significantly trailed its benchmark over the…
Halo Effect can be Dangerous to your Portfolio!
Charlie Munger once famously said, “It is remarkable how much long-term advantage people like us…


