Gulaq Gear 6 Performance Deep Dive of 2023
We launched Gulaq in 2020 as the retail arm of Estee Advisors Pvt Ltd. Estee had over a decade's worth of experience in building sophisticated quantitative algorithms for its HNIs and institutional clients. With Gulaq, we aimed to reach the masses and make our quant strategies available to everyone.
Gulaq Gear 6 is our flagship portfolio and has lived up to its reputation as the alpha-generating machine in 2023 by earning a whopping 67% return, beating the index by more than 2x.
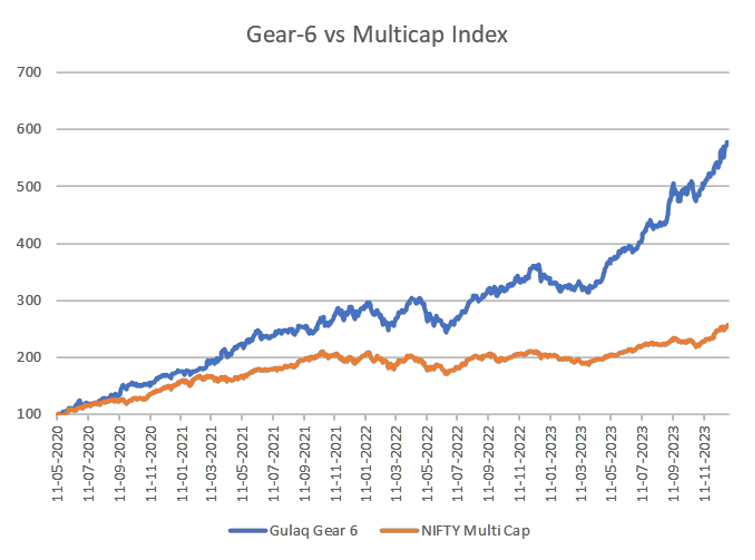
Since its launch in May 2020, Gear 6 has grown at a 60% CAGR and has outperformed the multi-cap index every single year.
Here is the 2023 Performance Deep Dive:
About Gulaq Gear 6
For those unfamiliar with our approach or new to us, here is a brief summary of our investment approach.
Gulaq portfolios follow multi-factor investing. We track 130+ factors, including fundamental, technical, and macroeconomic factors in our portfolio construction process. Every month, we gauge market movements, pick the best factors that are likely to work in the current market conditions, and accordingly rebalance our portfolios.
We focus primarily on delivering consistent performance with proper diversification across market caps, factors, and sectors. This approach helped us avoid extreme cases and consistently beat benchmarks.
Since launch, we have served over 15,000 happy investors.
Performance
Only a handful of the actively managed funds are able to consistently beat the market. In fact, almost two-thirds of all actively managed funds failed to beat their benchmark index last year.
How did we do?

Not only did Gulaq Gear 6 outperform the benchmark every single year, it has beaten the benchmark by a substantial margin.
Gulaq Gear 6 had a golden run in the years 2020 and 2021, with returns surpassing 60-70%. 2022 was a relatively moderate year but our portfolio still managed to outperform the index by about 18%. In 2023, Gulaq Gear 6 reverted back to its golden years and generated a whopping 67% return, beating the index by more than 2x.
If you had invested Rs.100 with us in May 2020, your investment would be worth about Rs. 579 today, compared to Rs.257 with the benchmark.
Although we don’t believe that it is appropriate to evaluate a portfolio’s performance on a monthly basis (as equity can be quite volatile in the short term), since we rebalance our portfolios monthly, let’s take a look at how Gulaq performed on a monthly basis against the benchmark.
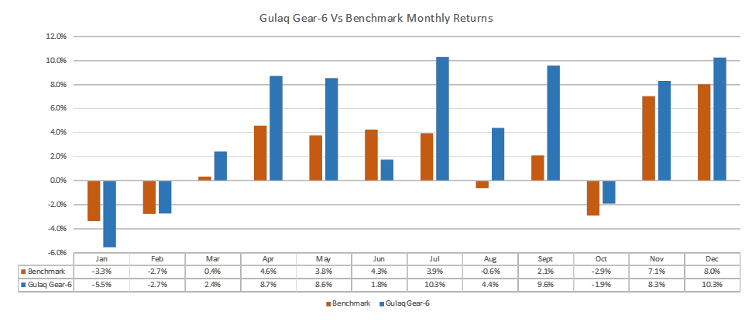
Gulaq Gear 6 performed particularly well in the second half of 2023, with the best months being July and December which delivered over a 10% return.
It is important to note that although our portfolio beat the index 9 out of 12 times, the initial couple of months were worse than the benchmark. If an investor had pulled their money after being discouraged by this initial underperformance, he/she would have missed the train that came in the second half of the year. This again reinforces the importance of thinking long-term and why we strongly advise against short-term investing.
When investing in any type of equity, it’s best to have at least a 3-year investment horizon, as equity can be quite volatile over the short run. If your investment horizon is shorter than this, you might be better off exploring funds with less than 100% equity allocation.
Stock Level Analysis
In 2023, our quant algorithm recommended a total of 56 stocks, of which 38 were profitable and 18 incurred losses. A win ratio of about 68%.
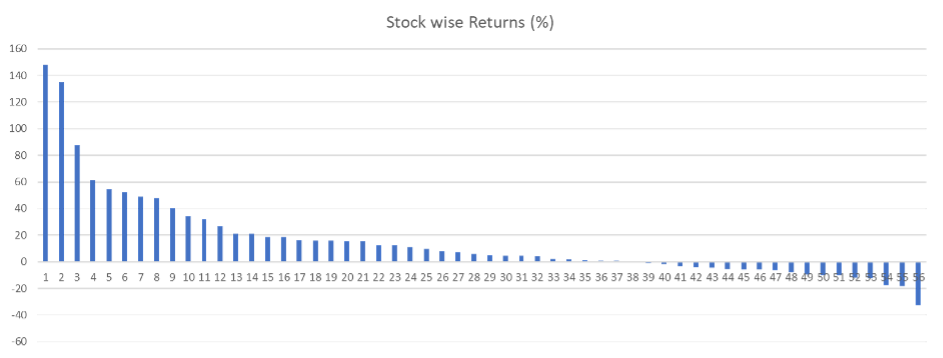
The best-performing stock yielded returns as high as 148%, while the worst-performing stock incurred losses as high as -33%. However, a more insightful perspective emerges when we examine the averages of our top 10 winners and losers.
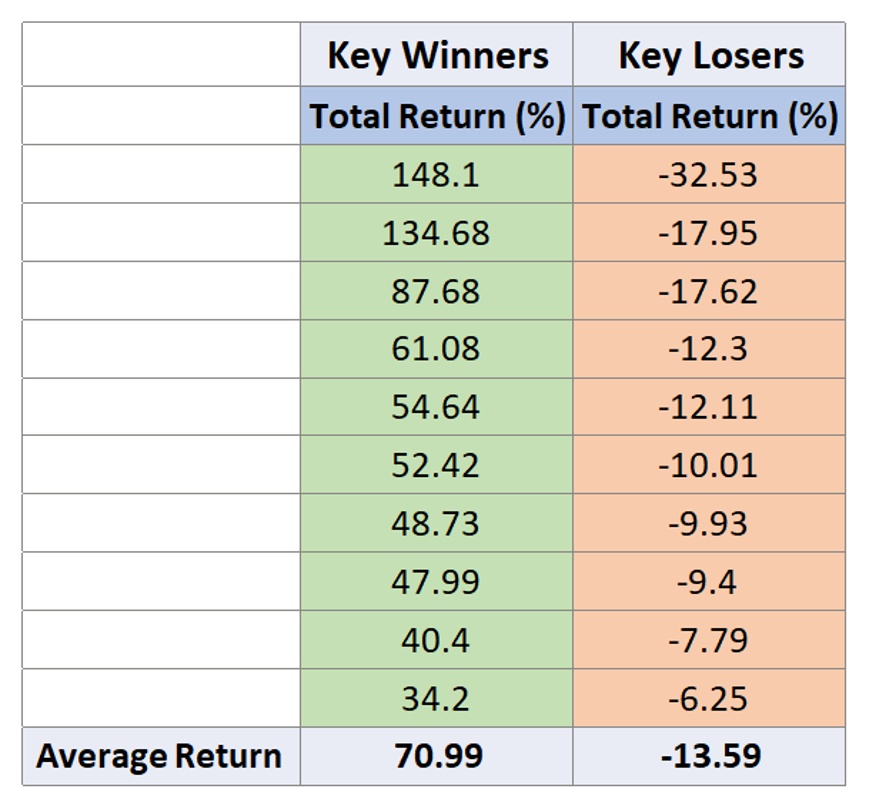
While the average return from our key winners stands at 70.99%, the average loss from our key losers is only 13.59%. This data suggests our success in retaining winning stocks while effectively limiting losses from underperforming ones by strategically removing them from our portfolio
Max Drawdown
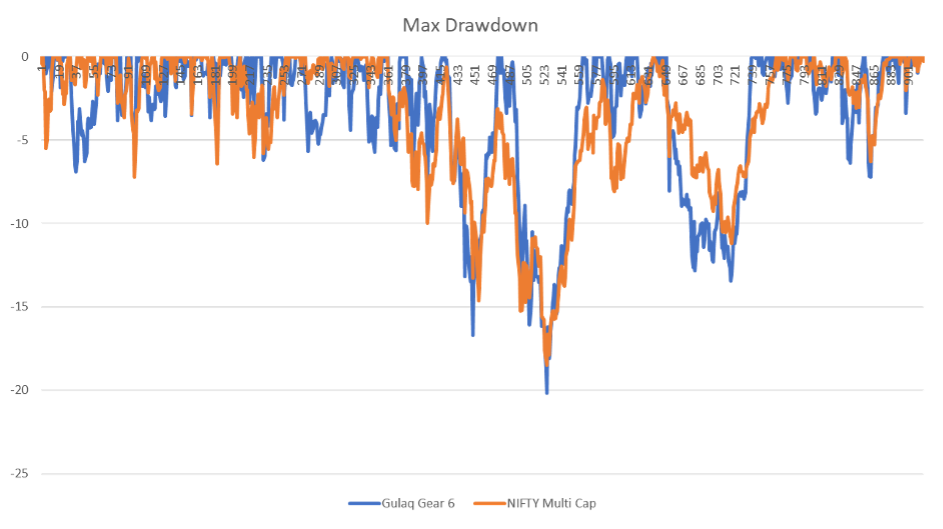
Max drawdown is a widely recognized measure in the industry used to assess the riskiness of a portfolio. It represents the largest percentage decline in the value of an investment from its peak to its lowest point. For instance, if your investment reaches a peak of Rs.1 lakh and then drops to Rs.80k at its lowest, the max drawdown would be 20%.”
Diversification
We look at diversification from 2 angles:
- Market Cap Allocation
- Sectoral Allocation
Market Cap Allocation
Gulaq Gear 6 is well diversified across market caps. The following table shows the average weight of Gulaq Gear 6 in Large cap, Mid cap, and Small-cap.
| Category | Benchmark Avg Weight (%) | Benchmark Total Return (%) | Benchmark Weighted Returns | Gulaq Gear-6 Avg Weight (%) | Gulaq Gear-6 Total Return (%) | Gulaq Gear-6 Weighted Returns |
|---|---|---|---|---|---|---|
| Large Cap | 85 | 25 | 21 | 45 | 85 | 38 |
| Mid Cap | 10 | 39 | 4 | 41 | 67 | 27 |
| Small Cap | 5 | 26 | 1 | 14 | 9 | 1 |
| Yearly Return | 26% | |||||
The biggest contributors to the alpha were the Large cap and Mid cap, contributing about 38% and 27% weighted average returns, respectively.
While the Large cap was responsible for almost 80% of the returns generated by the benchmark, Gulaq Gear 6’s performance was more diversified across market caps, with Large and Mid-cap contributing evenly to generate alpha.
Our Large cap allocation of 40% to 50% tends to bring stability to the portfolio, and the other constituents are incorporated to extract outperformance over benchmark indices like Nifty50 and Equity Multicap. Sectoral Allocation Sectoral allocation is one of the most important aspects of portfolio construction. Diversifying across sectors with low correlation is vital to creating a weather-proof portfolio that can withstand market turmoil and generate consistent returns. With Gulaq Gear 6, we diversified across 9 different sectors, tactically rebalancing the weights every month based on the latest market conditions. In sector allocation, success hinges on being right on 2 fronts:
In terms of weight allocation, we successfully identified the best-performing sectors and strategically overallocated to them. Industrials, the top-performing sector, received an average capital allocation of about 25%, in contrast to the index’s modest 8.9% allocation. Similarly, the IT sector, another high performer, commanded a 21% weight, compared to the benchmark’s 10.7%.
Not only did we successfully overweight the best-performing sectors, but we were also successful in selecting the right stocks within those sectors. For example, while Industrials generated a total return of approximately 48.47% in the index, our selections within the sector yielded an impressive 108%. Similarly, the IT sector, along with consumer staples, consumer discretionary, and utilities, delivered better returns than the index due to our superior stock selection.
| Sectors | Benchmark Avg Weight (%) | Benchmark Total Return (%) | Gulaq Gear-6 Avg Weight (%) | Gulaq Gear-6 Total Return (%) |
|---|---|---|---|---|
| Industrials | 8.92 | 48.47 | 25.04 | 108.36 |
| IT | 10.72 | 22.82 | 21.15 | 83.81 |
| Consumer Staples | 8.91 | 27.99 | 13.27 | 77.07 |
| Financials | 30.79 | 17.58 | 10.43 | 17.11 |
| Materials | 9.78 | 23.32 | 10.04 | -49.39 |
| Health Care | 5.16 | 236.86 | 9.97 | 22.82 |
| Consumer Discretionary | 9.84 | 43.80 | 7.42 | 58.78 |
| Utilities | 3.57 | 15.05 | 2.55 | 67.04 |
| Energy | 8.60 | 21.77 | 0.12 | 0.64 |
| Communication Services | 2.68 | 27.53 | 0 | 0 |
| Real Estate | 0.92 | 78.43 | 0 | 0 |
Summary
The year 2023 marked a tremendous success for both our team and the investors who joined us on this journey. Our flagship portfolio, Gulaq Gear 6, delivered an astounding 67.29% return, surpassing the multi-cap index by over 2x.
While we have achieved a remarkable 50%+ CAGR over the past 3.5 years, it would be unrealistic to expect similar returns over the long run (10 years). Our goal is to consistently outperform the index and generate alpha in the range of 8 to 10%.
Intelligent investors should maintain reasonable expectations to avoid unnecessary disappointment and the behavioural mistakes that investors often make when chasing aspirational returns.
At Gulaq, our mission is to make systematic investing accessible for everyone. If you aren’t already a subscriber to our Gulaq portfolios, we would love to welcome you to our family. Happy investing!
Related Posts
Process Matters More Than Outcome
I have spent nearly a decade of my life trading energy derivatives, and today I…
Is Market Cap the Best Way to Build an Index?
Nifty 50 is a free-float weighted index – a slight variation of market cap weighted…
3 Books That Changed How I Think About Risk and Markets
Over the past two decades, I’ve built a quiet but consistent habit — reading. Not…
All Nifty Bees Are Equal — But Some Are More Equal Than Others
The title, inspired by George Orwell’s classic Animal Farm, perfectly captures the essence of this…


