Estee Advisors was founded in 2008 with a vision of making investment decisions using sophisticated quantitative models. Over the past 15+ years, Estee has developed leading investment and broking products using analytics and computer science
Long Alpha is Estee’s long-only equity strategy that aims to consistently outperform the benchmark equity index while maintaining low volatility. In FY24, it delivered a solid 76.2% return against the benchmark BSE 500’s 40.2% return.
In this blog, we will take a deep dive into the performance of our Long Alpha product for FY23-24.
Key Takeaways:
- Long Alpha is Estee’s algorithmically created Quant portfolio that follows a multi-factor investment strategy.
- In FY23-24, it delivered 76% return against the benchmark BSE 500’s 40% return, generating an alpha of 36%.
- ₹50L invested in Long Alpha since revamp (May, 2019) would be around ₹2.1Cr now, compared to just ₹1.1Cr with the BSE 500.
- Since inception, Long Alpha has had an annualized risk of 17.7% compared to 18.9% of BSE 500.
- The Maximum Drawdown for Long Alpha since inception has been around 17.2% compared to BSE 500’s 28.8%.
Investing Methodology
Long Alpha is a fully quantitatively managed strategy that implements a systematic, rule-based trading model to remove human subjectivity.
The strategy follows a multi-factor approach to identify investable businesses from the S&P BSE 500 universe and optimizes for risk-adjusted returns.
The underlying principle of factor investing is that certain factors have historically provided higher returns than the broader market over the long term. By targeting these factors, we aim to achieve superior risk-adjusted returns compared to the index.
Some of the most popular factors that we employ in our strategy are:
-
Quality: Selecting securities with the best set of clearly defined fundamental criteria. This methodology includes several sub-factors based on fundamentals within balance sheets as well as cash flow statements.
-
Momentum: Selecting securities that have been showing a robust price trend. Momentum investing is based on having several sub-factors based on various strong technical indicators as well as statistics, along with dynamic switching among these sub-factors.
-
Volatility: Selecting securities that have shown optimal volatility along with low sensitivity to the market based on statistical analytics.
-
Leverage: Selecting companies with decently moderate leverage levels which also show promising growth in terms of financial and market returns. In this factor, we try to select the best companies based on their debt levels.
-
Value: Comparing a company’s fundamentals with its current market price. This factor selects companies that are seen to be undervalued with respect to their fundamentals. It is expected that such stocks will revert to their intrinsic levels in the future and provide substantial returns relative to other stocks.
Under the Long Alpha strategy, we track over 130 factors, including macroeconomic, fundamental, and technical factors. These factors encompass every conceivable piece of information that impacts the security’s price.
Our sophisticated algorithms are trained to identify which factors are currently hot by reading the current market atmosphere and accordingly suggest allocation across a range of sectors and market caps to construct a portfolio capable of beating the benchmark while maintaining low volatility.
Performance
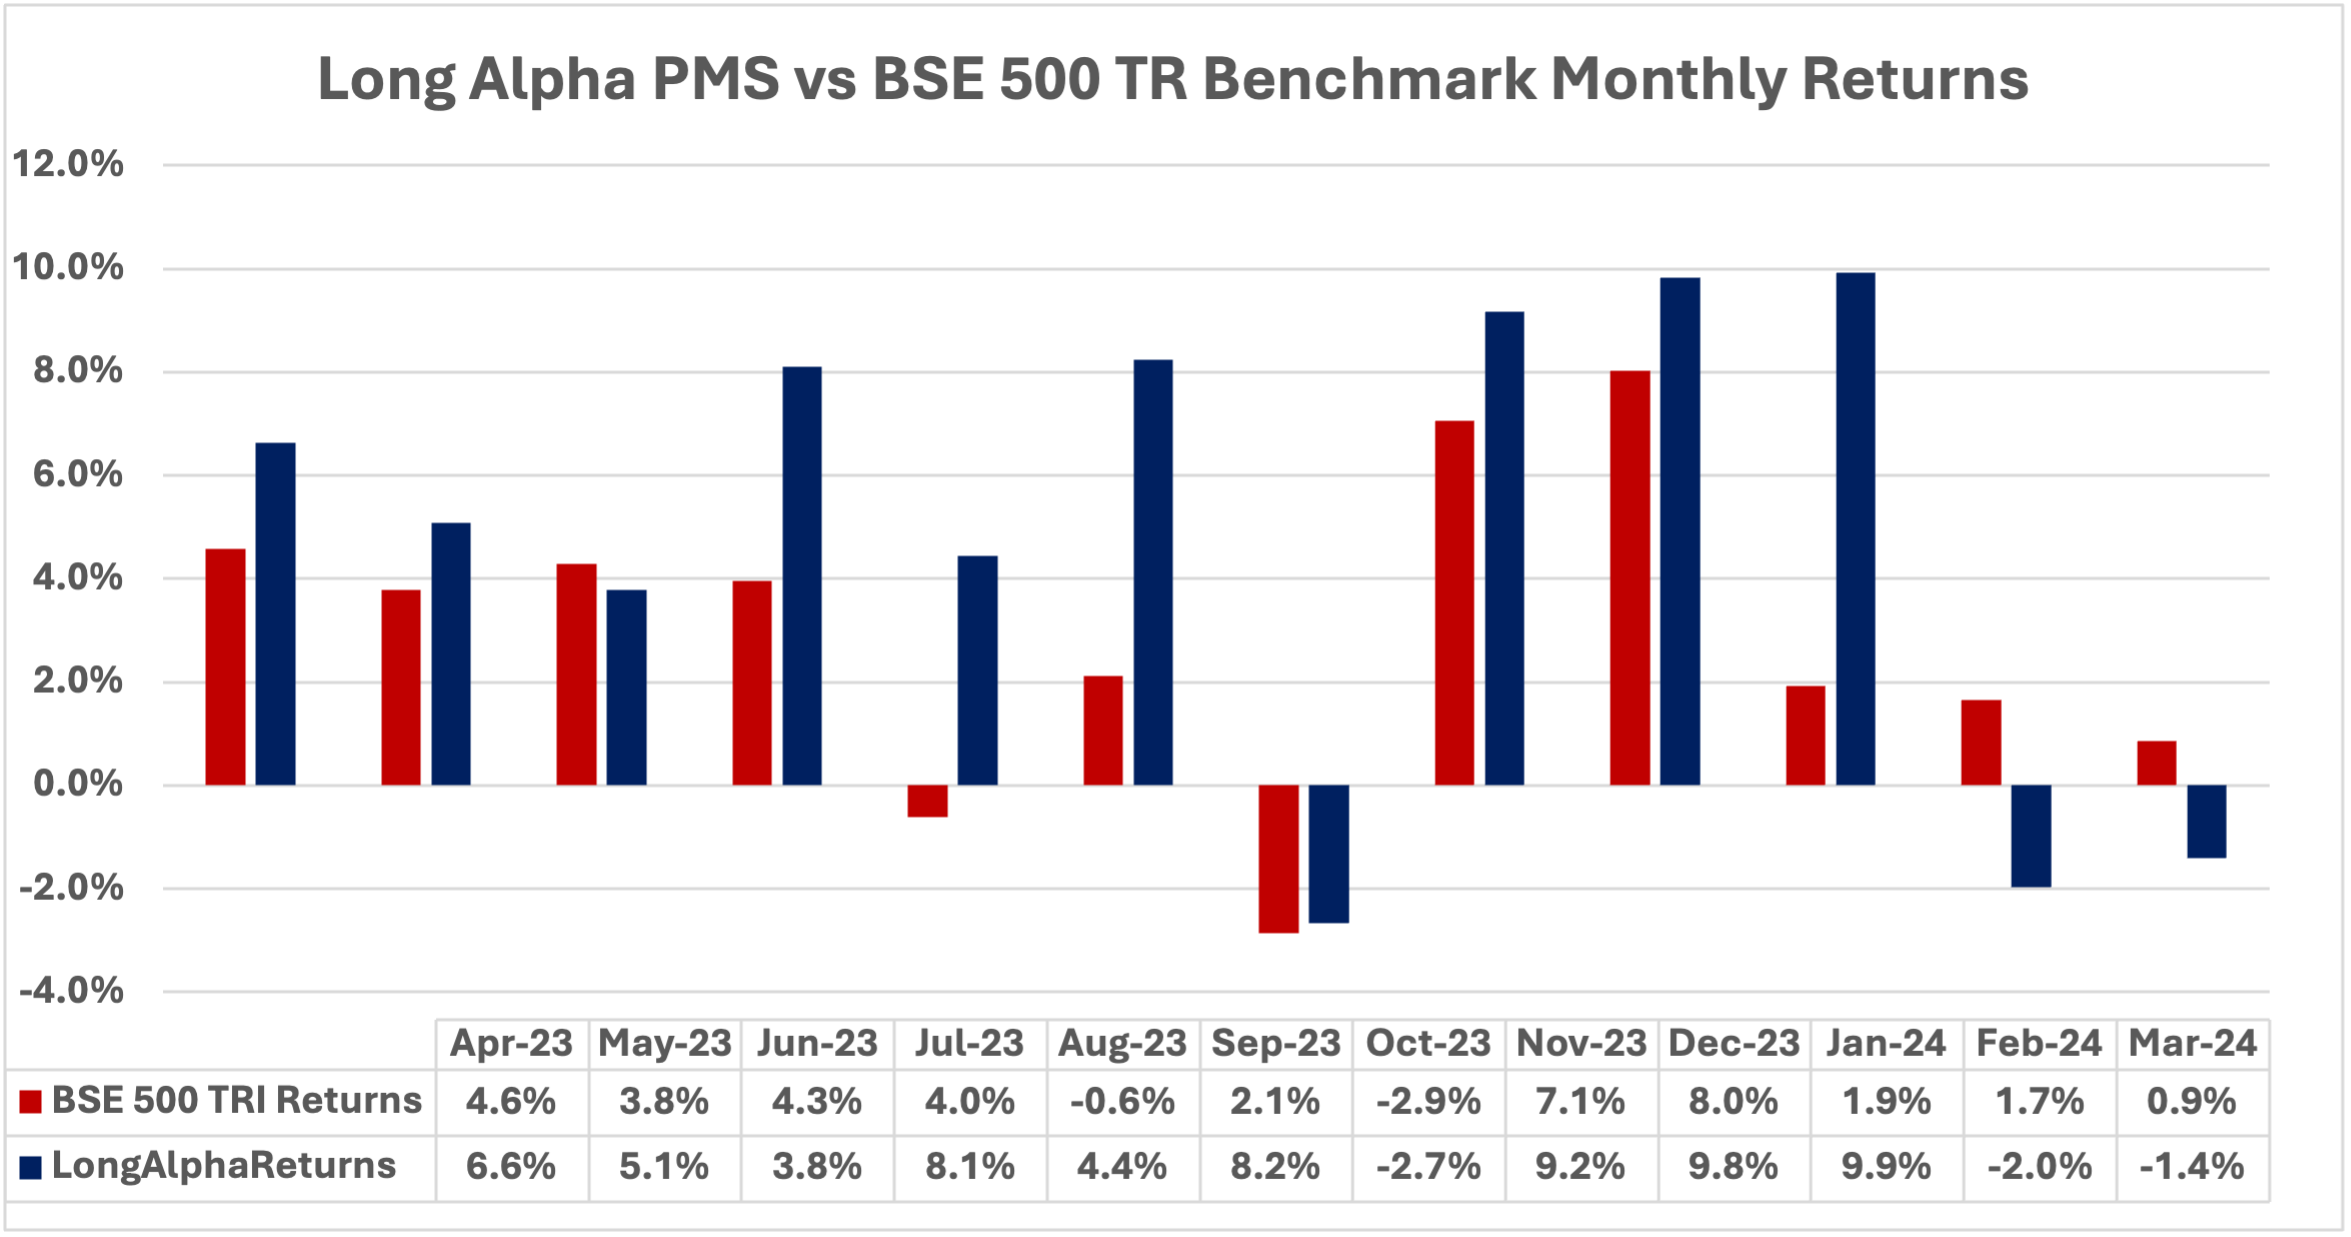
Long Alpha outperformed and generated alpha over the BSE 500 Total Return Index in 10 out of 12 months, underperforming only in February and March.
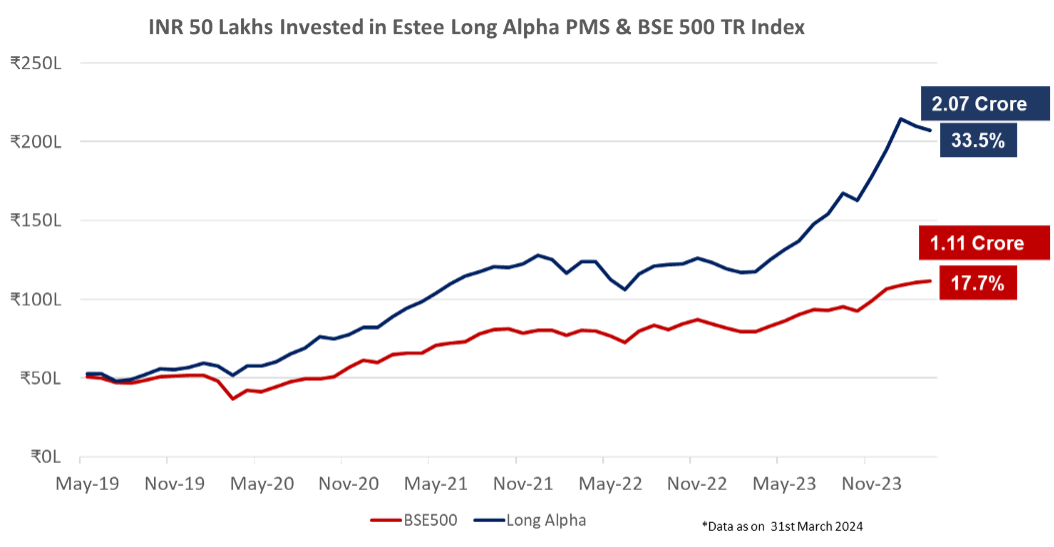
If you had invested ₹50L in Long Alpha in May 2019, the current value of your investment would be around ₹2.07Cr compared to ₹1.11Cr with the BSE 500.
Long Alpha has grown at a compounded annual growth rate (CAGR) of 33.5% against the BSE 500’s 17.7% since May 2019.
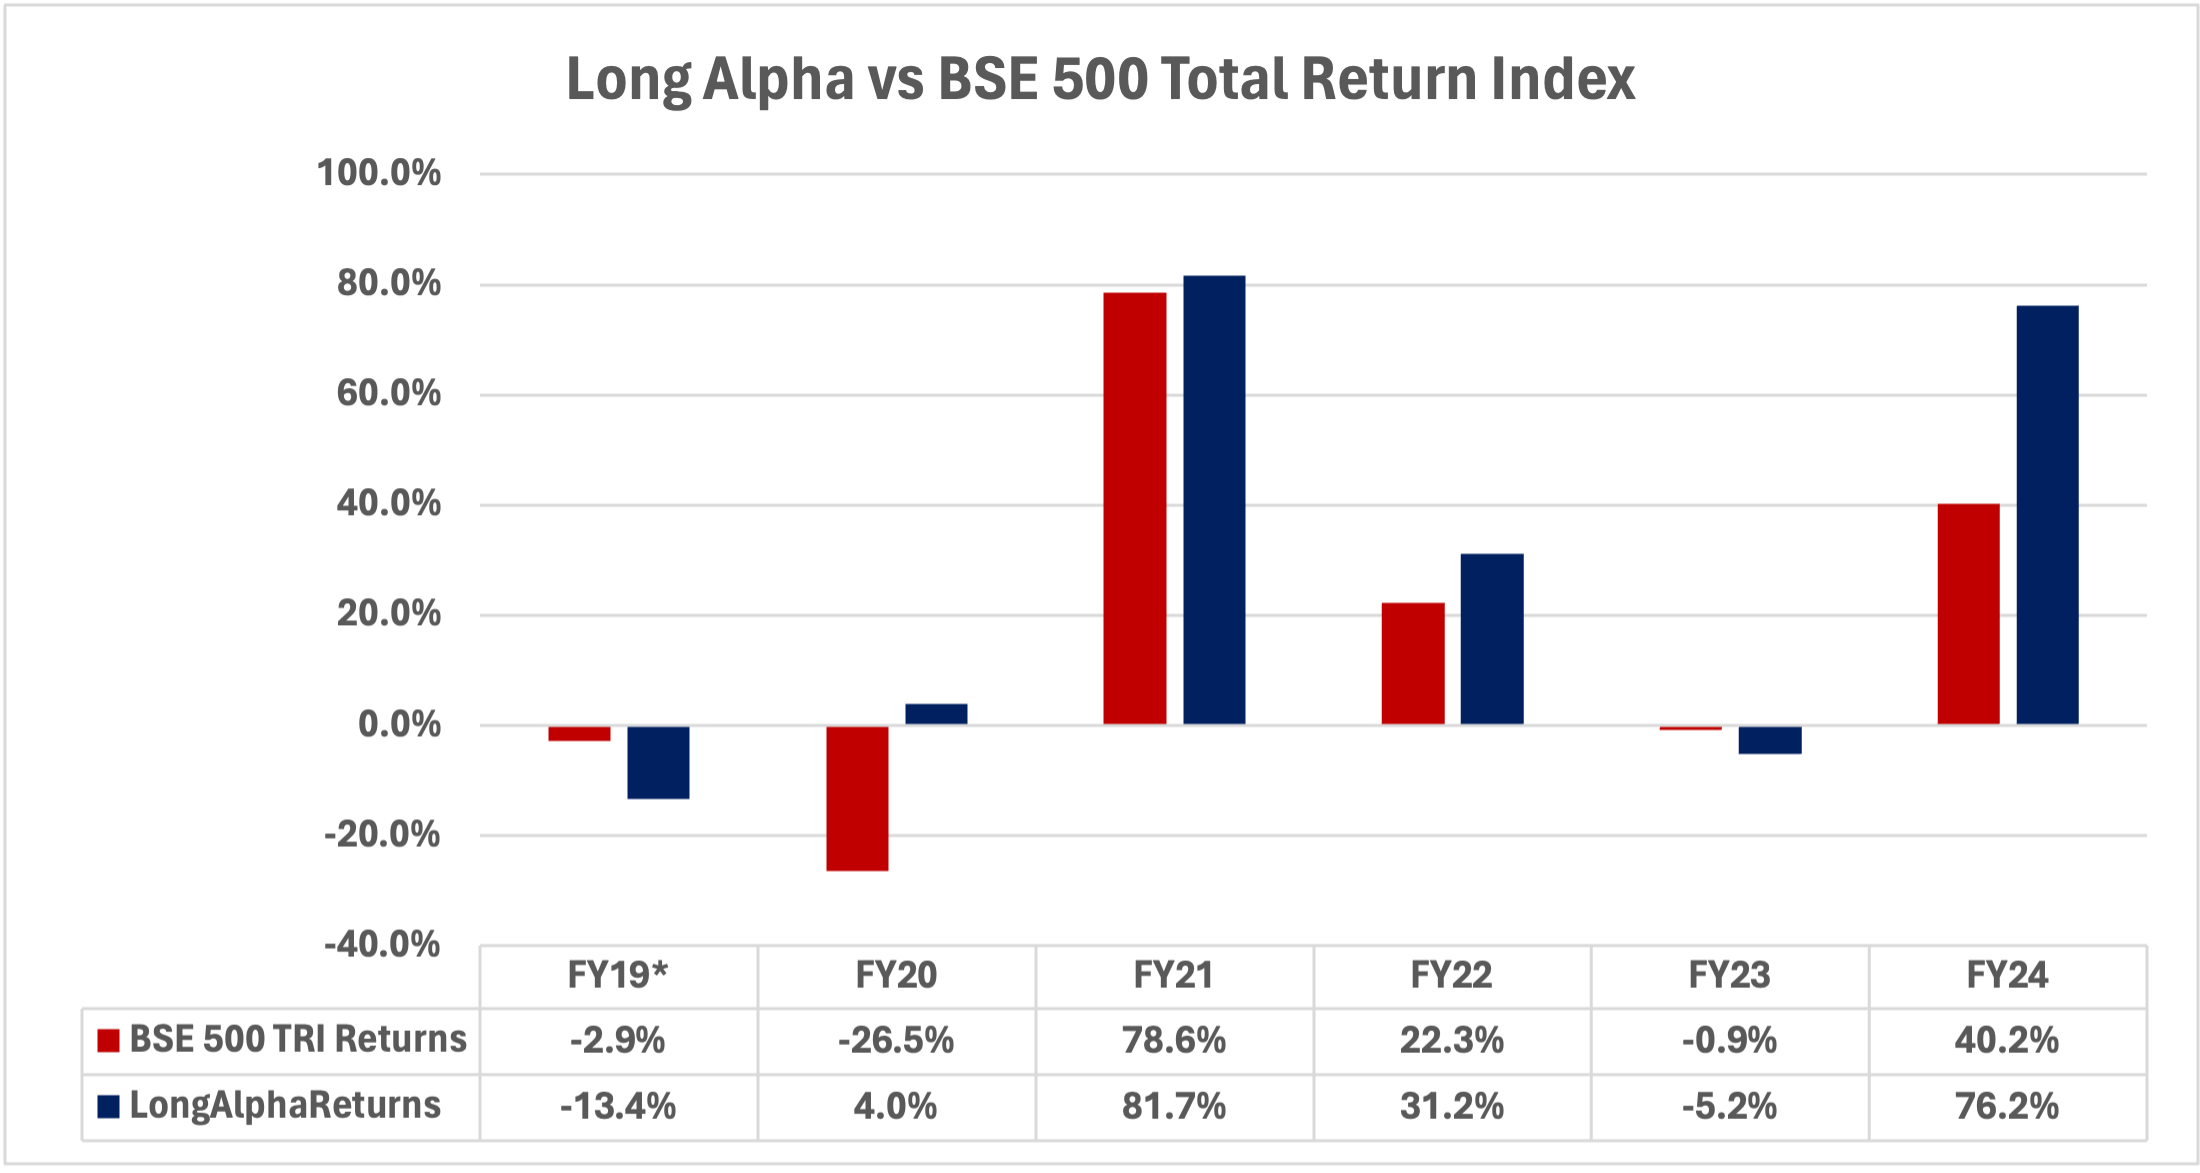
Since inception, Long Alpha has outperformed the BSE 500 Total Return Index in 4 out of 6 years. Last financial year, our strategy produced 76.21% gross returns, an excess return of 36.01% over the BSE 500.
Comparing returns is only half the picture. Let’s analyze the performance of Long Alpha through the lens of risk.
Risk
We are going to take 3 metrics to compare risk – standard deviation, maximum drawdown, and Sharpe ratio.
- Standard deviation measures on an average how far your returns deviate from the mean return. A higher standard deviation indicates a higher investment risk.
- Max drawdown is the largest percentage decline in the value of an investment from its peak to its lowest point. For example, if your investment peaks at ₹1L and then drops to ₹80K at its lowest, the max drawdown would be 20%.
- Sharpe Ratio is a measure of risk adjusted returns - returns earned per unit of risk. It's calculated by dividing the investment's excess return (return above a risk-free rate) by its standard deviation. A higher Sharpe ratio indicates better risk-adjusted returns.
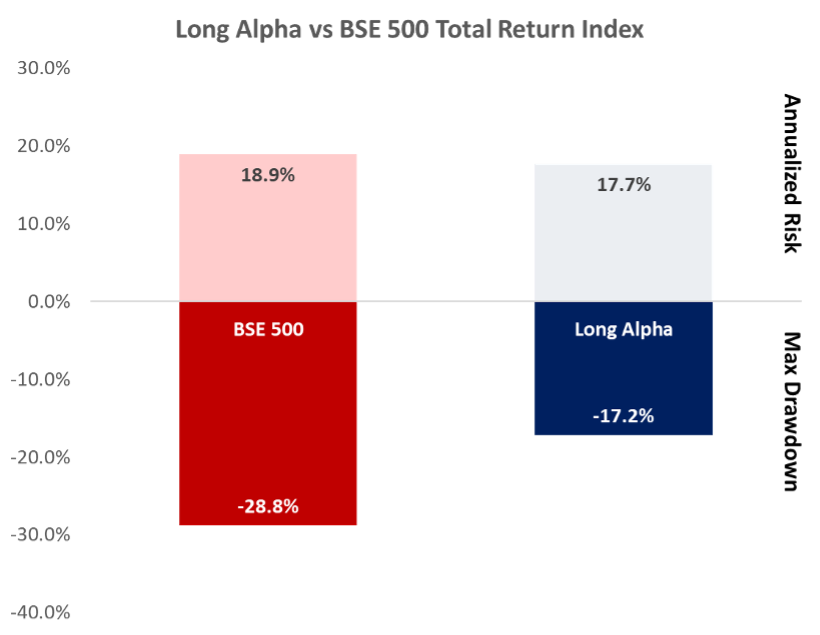
Since inception (September 2018), the annualized risk (measured in terms of standard deviation) of Long Alpha is 17.7% compared to the BSE 500’s 18.9%.
The maximum drawdown of Long Alpha is just 17.2% compared to 28.8% for the BSE 500. The 28.8% drawdown of the BSE 500 occurred during the COVID-19 panic sell-off in March 2020. During those difficult times, Long Alpha was able to withstand the heat of the market, suffering a drawdown of only 12.2%, and reinforced our belief in the resilience of our strategy.
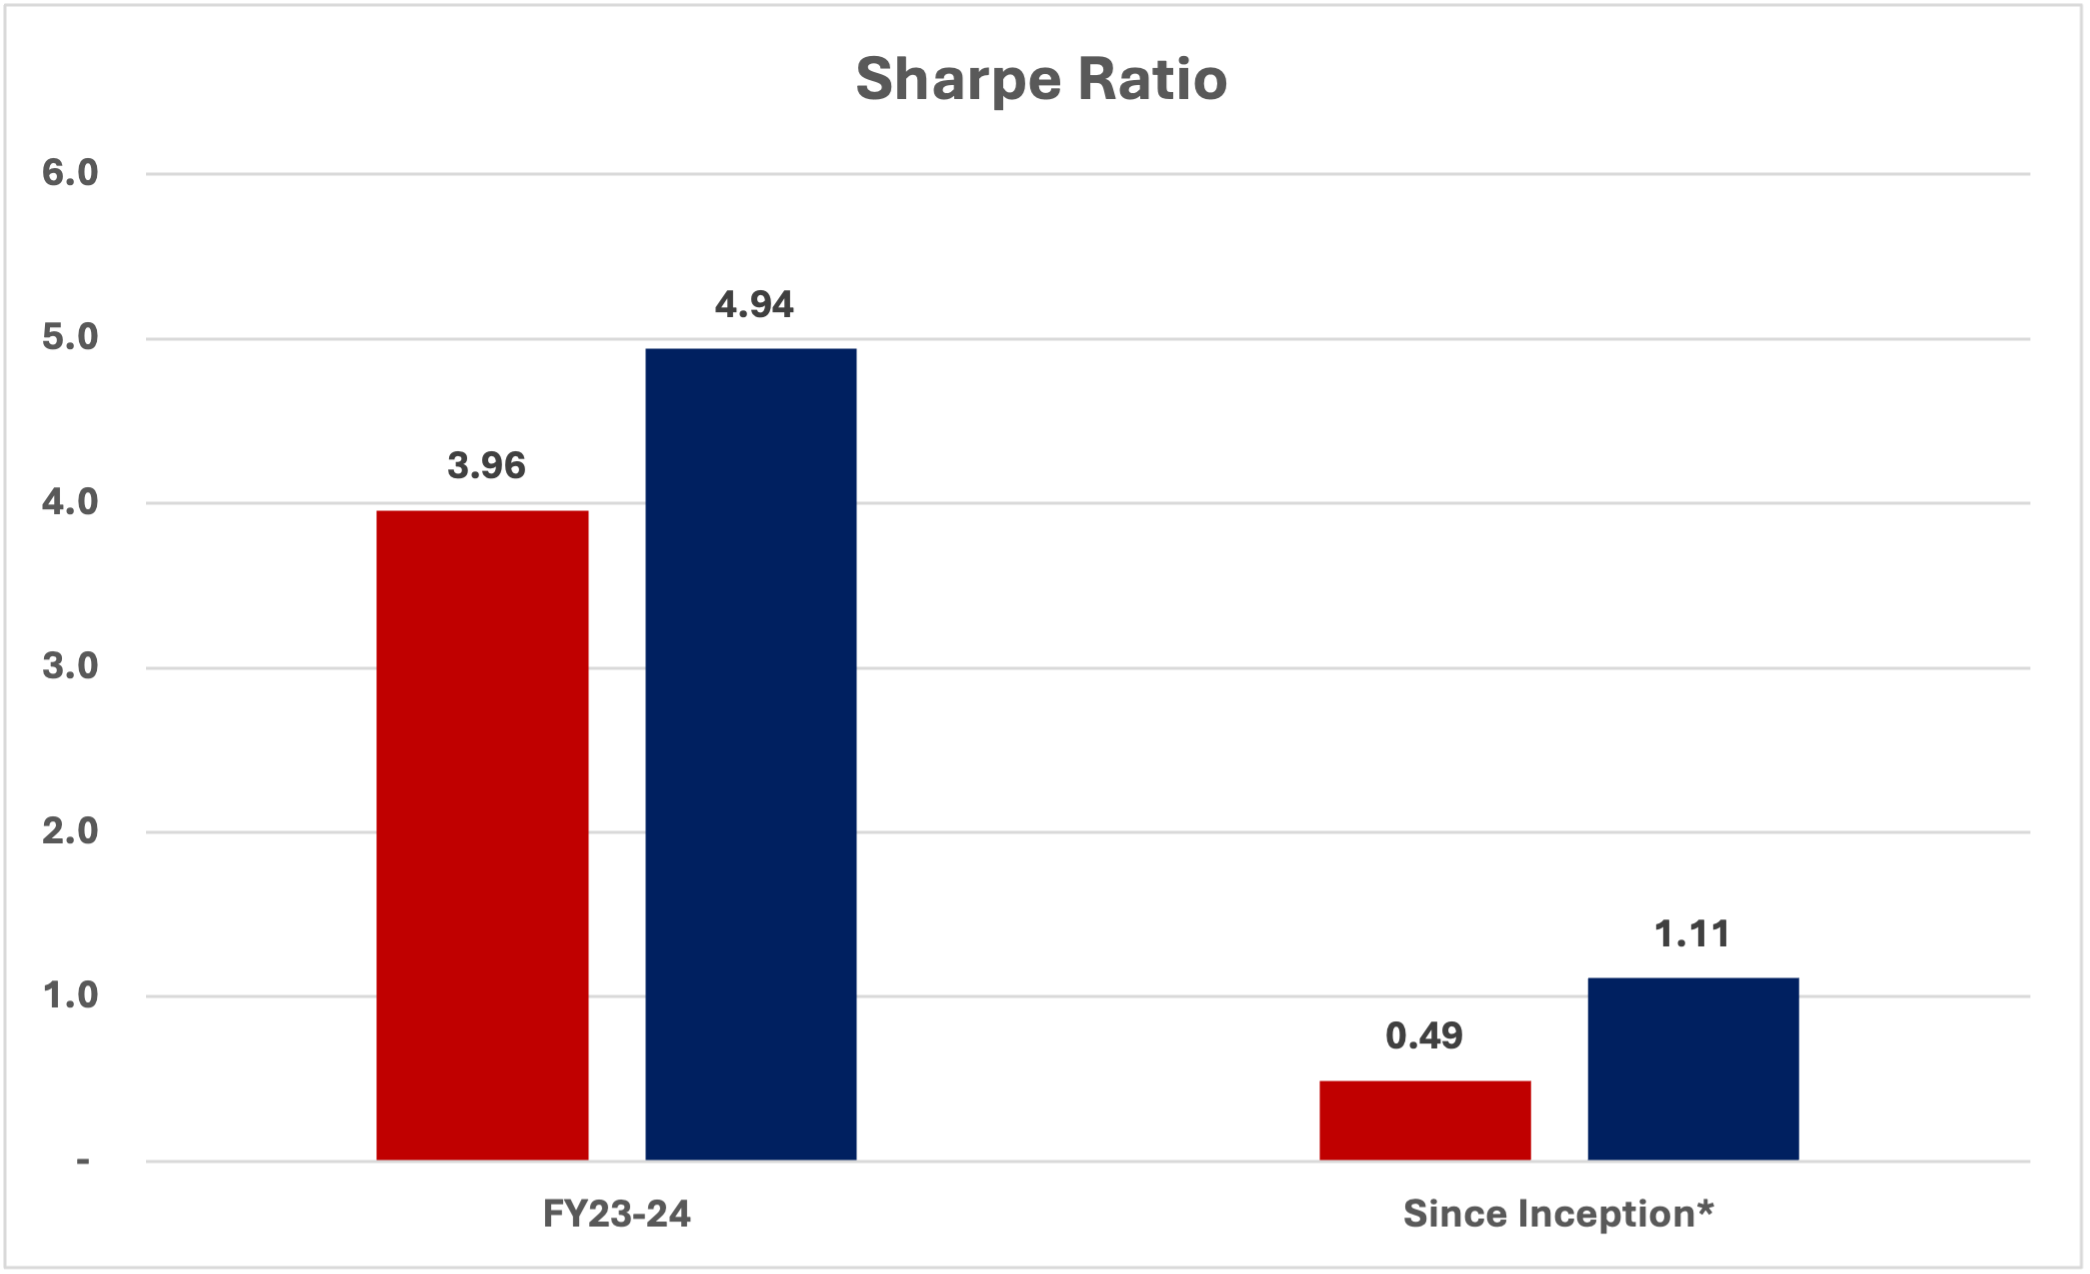
Turning our attention to the Sharpe ratio, Long Alpha’s superior performance becomes more apparent.
During FY23-24, Long Alpha produced a Sharpe ratio of 4.94 compared to 3.96 for the BSE 500. The relative gap widens as we look at long-term risk-adjusted performance.
Long Alpha has been able to produce excess returns over the benchmark BSE 500 while maintaining lower volatility. This has been made possible by Long Alpha’s robust risk management strategy.
Our sophisticated quant algorithms are designed to maintain healthy diversification not only across sectors but also across market capitalizations. At any given point in time, Long Alpha’s portfolio contains 80-100 stocks. This approach goes against the general perception that creating a concentrated portfolio of a few stocks is necessary to generate alpha. The healthy diversification allows us to spread our bets more evenly and generate consistent alpha while maintaining controllable levels of risk.
Ending Note
Our PMS products have consistently built wealth for our investors by employing sophisticated quantitative models and robust risk management strategies.
We constantly optimize our strategies to stay on top of the dynamic market environment. Our algorithms consume every conceivable data that can be consumed by computers and produce an objective and data-drive investment strategy that is free from human bias.
Quant based investing style is relatively new in India and had only recently started gaining traction. If you wish to learn more about our PMS products, feel free to reach out to our team of professionals who would be happy to assist you, or you can check out Long Alpha PMS’ latest factsheet.
Thank You for Reading & Happy Investing!