

FY23-24 was a great year for equity markets. Nifty 500 itself delivered more than a 40% total return.
In this blog, we are going to take a deep dive into how various factors indices performed during the last year’s bull run.
But first, let’s get down to the basics.
What is Factor Investing?
Factor investing is an investment strategy that involves selecting securities based on certain characteristics or factors that are believed to contribute to their returns. These factors can include characteristics such as momentum, value, quality, and low volatility, among others.
The underlying principle of factor investing is that certain factors have historically provided higher returns than the broader market over the long term. By targeting these factors, investors aim to achieve superior risk-adjusted returns compared to traditional indexes.
Some of commonly recognized factors are:
- Momentum: Stocks that have exhibited strong growth in the recent past are expected to continue performing well in the near future.
- Value: Stocks that are considered undervalued relative to their intrinsic value, often measured by metrics like price-to-earnings ratio or price-to-book ratio.
- Low Volatility: Stocks with lower volatility compared to the broader market, which can provide downside protection during market downturns and deliver higher risk adjusted returns.
- Quality: Companies with strong fundamentals, such as high profitability, stable earnings growth, and low debt.
So how did these factors perform last year? Let’s find out.
Performance Analysis
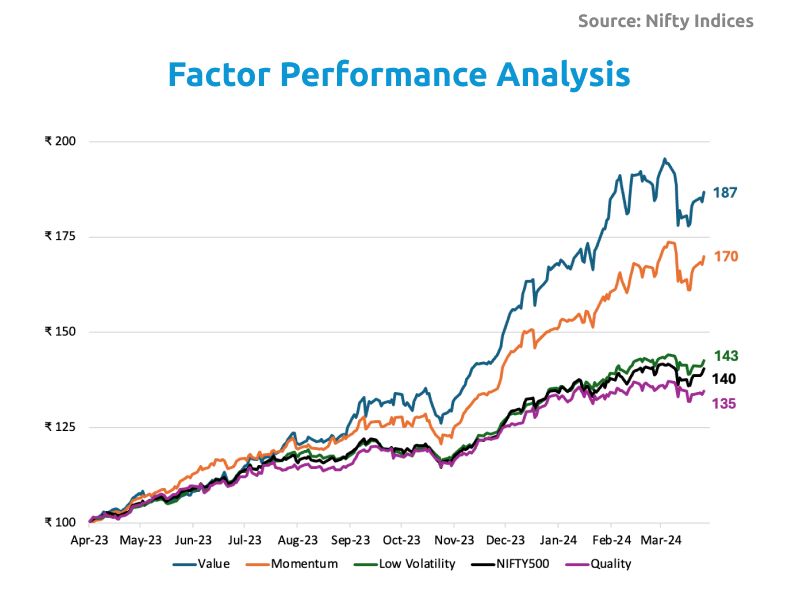
We are taking Nifty’s strategic factor indices as a proxy for the performance of various factors.
Value had an outsized performance last financial year. It delivered returns more than double that of Nifty 500. This was primarily due to the rally that we saw in the PSU stocks that generally trade at a lower price-to-earnings ratio.
Not too far behind, Momentum too had a phenomenal performance this year. It wasn't too surprising since the momentum factor tends to be hot around times when markets are consistently breaching all-time highs. Last financial year, Sensex was trading at its all-time high values around 15% of the time compared to 6-7% of the time normally
Low volatility too did not disappoint. It performed similarly to that of Nifty 500 although it delivered a slightly higher return with slightly lower risk. The quality stocks, however, lagged behind the rest of its peers. It wasn't able to beat Nifty 500 but still delivered decent performance.
But comparing returns is only half the picture. Let’s look at risk.
Risk
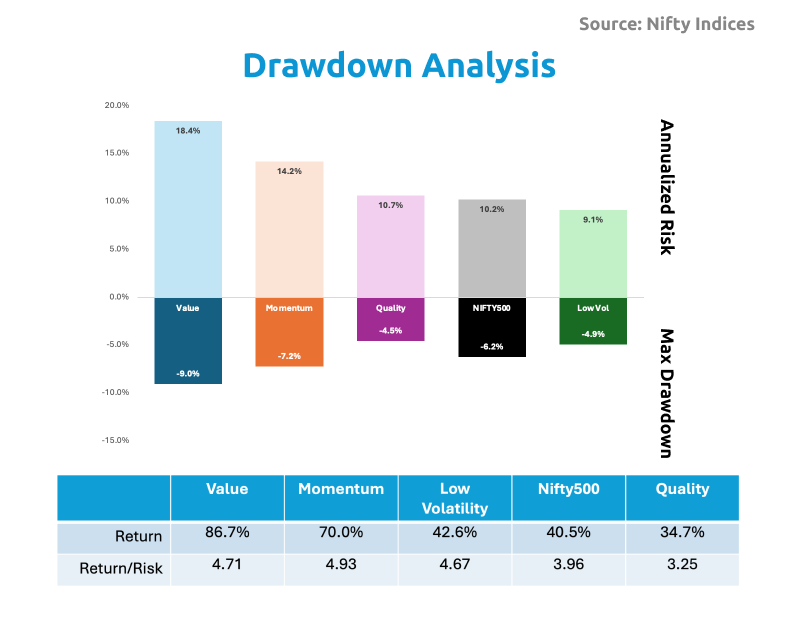
The above graph compares the risk of different factors and Nifty 500 based on their maximum drawdown and annualized standard deviation.
Max drawdown is the largest percentage decline in the value of an investment from its peak to its lowest point. For example, if your investment peaks at ₹1L and then drops to ₹80K at its lowest, the max drawdown would be 20%.
Standard deviation measures on an average how far your returns deviate from the mean return. A higher standard deviation indicates a higher investment risk.
We see that Value stocks, which performed the best in terms of returns, also carried the most amount of risk; it had the largest drawdown and the highest standard deviation. At the other end of the spectrum, low volatility experienced the least drawdown and had the lowest risk.
In terms of return earned per unit of risk, momentum stands out as the top performer, followed by value and low volatility. All factors, except for quality, showed significantly higher risk-adjusted returns compared to Nifty 500.
It is important to note that this year will go down in the history books as an outlier event, and extrapolating this performance into the near future would be unrealistic. Eventually, stocks revert to their means. With that being said, let’s analyze the long-term performance of these factors.
Long-term Performance Comparison
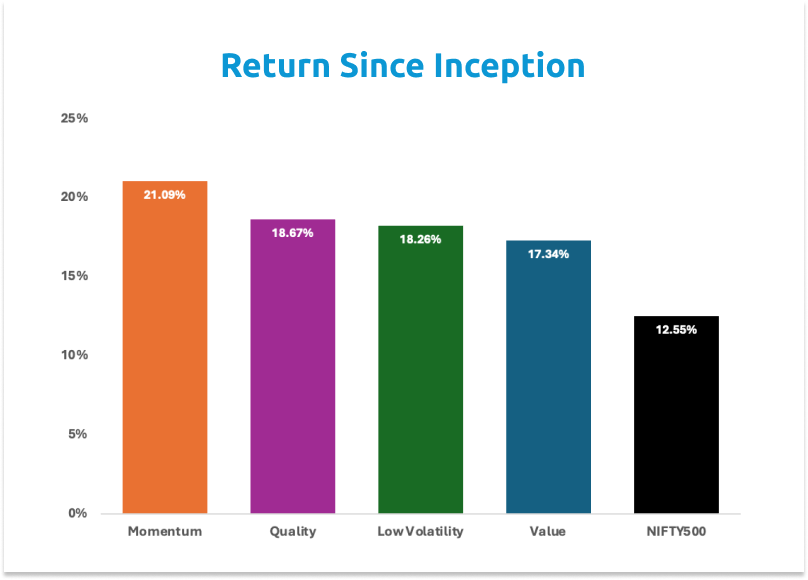
Analyzing long-term performance can reveal valuable insights into the performance of various factors. The graph clearly shows Momentum standing on top of the podium with other factors closely following suit.
Each factor’s long-term performance is considerably higher than the Nifty’s 500 with the average outperformance of 6.3%.
The 6.3% outperformance may not seem a lot, however, above average performance sustained for an above average period of time creates exceptional returns. ₹1L invested for 20 years, would turn into ₹10.6L compounding at 12.55% compared to ₹31.5L compounding at 18.84%.
Analyzing long-term performance reveals valuable insights into the performance of various factors. The graph clearly shows Momentum standing on top of the podium with other factors closely following suit. Each factor’s long-term performance is considerably higher than the Nifty’s 500 with an average outperformance of 6.3%.
Bottom Line
We believe multi-factor investing is the best way to invest. It is objective, data-driven, and eliminates the possibility of human biases influencing decision-making. The above study reinforces our conviction.
We are pioneers in the quantitative investing space in India. If you believe in our style of investing, check out our algorithmically created multi-factor portfolios, Gulaq portfolios on Smallcase.
Till then,” In God we trust. All others must bring data.” - W.E. Deming
Related Posts
The Evolution of Factor-Based Investing
Imagine you’re a student preparing for an important exam. What are the factors you think…

How Investors Lost Money in Peter Lynch’s Magellan Fund
The Magellan Fund, managed by Peter Lynch from 1977 to 1990, is legendary in the…

Time In The Market > Timing The Market
Imagine if taking a few days off your work cost you your entire salary. Sounds…
Identifying Overvalued Stocks: A Proof by Contradiction Approach
Proof by contradiction is a logical method used in mathematics to prove a statement…